
Why 20 Small Projects Beat 2 Mega-Projects. Diversification isn't just for stock portfolios.
12%Over budget
2.06xSmall wins
 Member
Every decision links to its evidence, its method,
the people around it, and what it taught us.
Capvium is the AI operating system for enterprise capital allocation and capital project portfolio decisions.
Request demoWhere capital competes
Capvium continuously evaluates capital, resources, schedules, market conditions, and risk across your portfolio — recommending where investments should accelerate, pause, or stop.
Ingest Simulate Size Decide Learn
Three questions decide whether a capital plan survives the year. The engine answers all three on the same portfolio, in the same run.
Identify the projects that create the greatest value for the risk taken.
| Project | Sector | Expected Value(NPV £M) | Risk Signal(L. Risk) | Verdict |
|---|---|---|---|---|
| Refinery Expansion | Energy | £78.6M | 2.8% | Proceed |
| Data Centre Build | Digital Infra | £64.3M | 4.2% | Proceed |
| Wind Portfolio | Renewables | £32.1M | 6.7% | Watch |
| Fleet Renewal | Logistics | £18.7M | 9.3% | Do not allocate |
Size every commitment in dollars under the actual available budget.
Stress-test the portfolio and see the probability of an unacceptable loss.
Target ≤ 5% · Max loss (stress): £146M
Products
Chronova
How Chronova carries a capital book from portfolio inputs to post-decision tracking: eight stages, one engine. Select a stage, or let it play.
Prognode
The megaproject that foresees its own future. Double-click any node or figure to see what is at risk and why.
Atelier
What you know, and what the outside record shows, turned into a risk picture of your whole portfolio. Double-click anything to look closer.
Total Capex
$121.5M
Blended Return
+20%
Blended Downside
-9%
Stress Scenario
| Claim | Vertical | Budget | Exp. Return | Downside | Decision |
|---|---|---|---|---|---|
| Annual Capex Baseline | Oil & Gas | $42.0M | +18% | -6% | Proceed |
| Maintenance vs Growth Allocation | Infrastructure | $28.5M | +13% | -9% | Stage |
| Fleet Renewal Replacement | Oil & Gas | $16.2M | +22% | -13% | Hedge |
| Energy Transition Transformation | Data Centers | $34.8M | +26% | -10% | Stage |
Decision Readout
← Annual Capex
63.6
Decision Score
Proceed
Capital is cleared to deploy at the current size and pace.
Projected outcome band: -6% → +18%
Everything lives in one workspace, from the first uploaded schedule to the committee-ready scorecard.
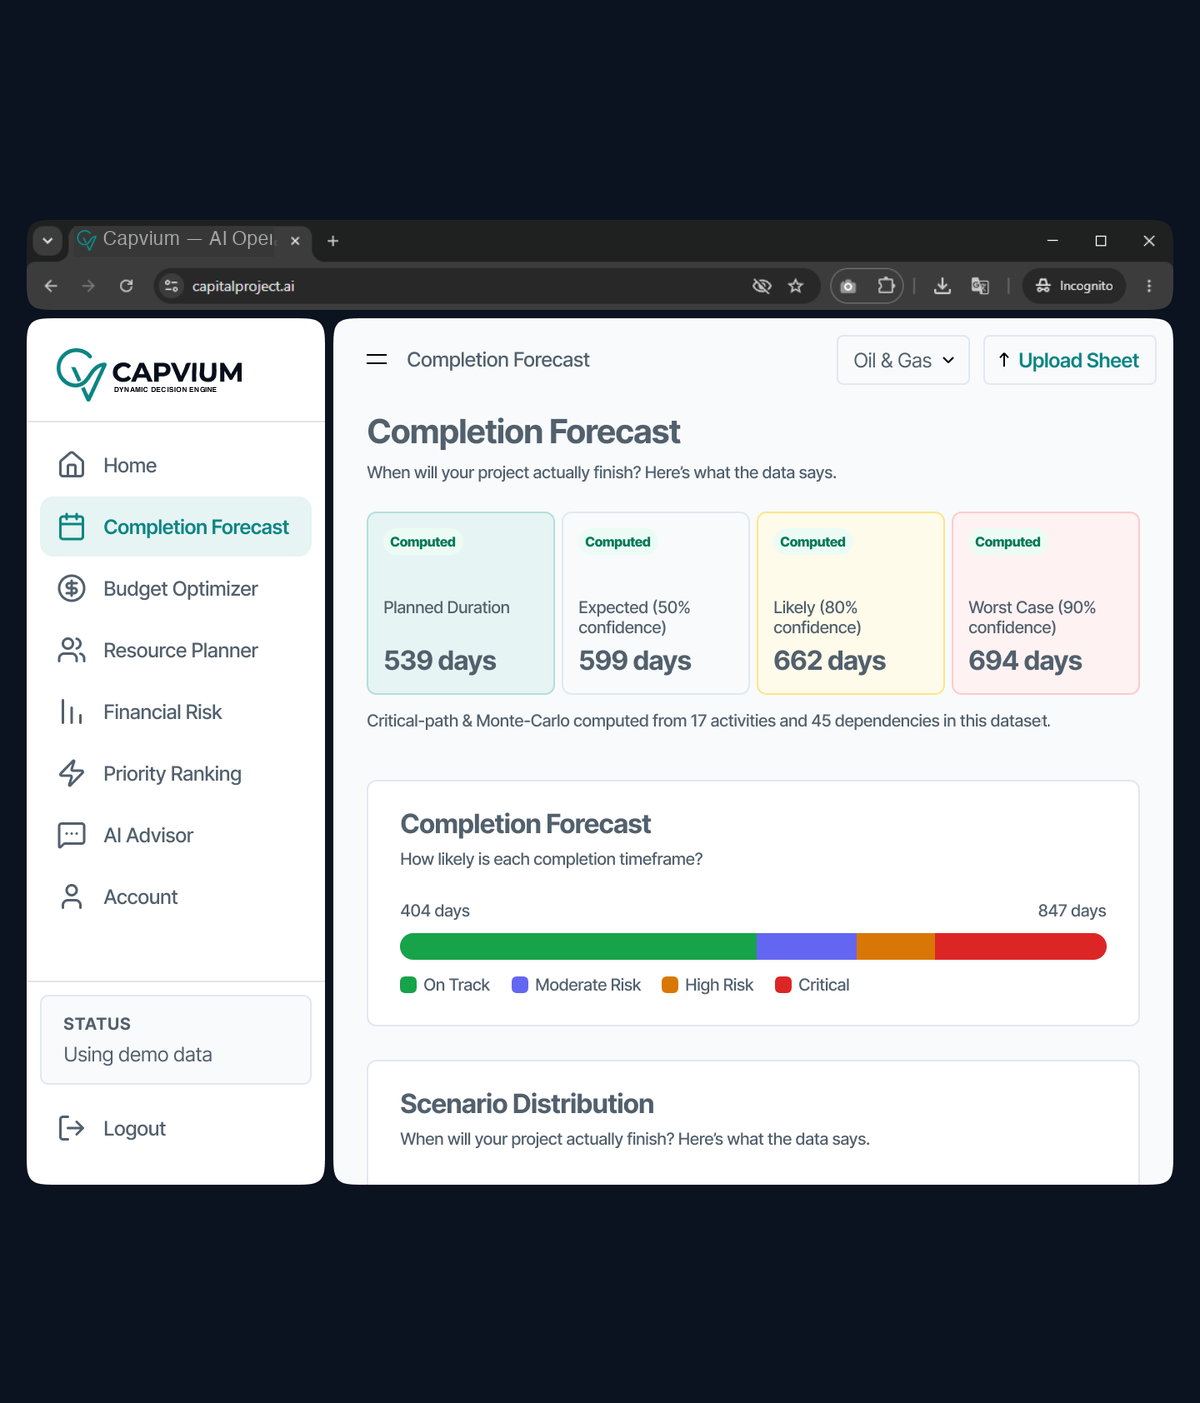
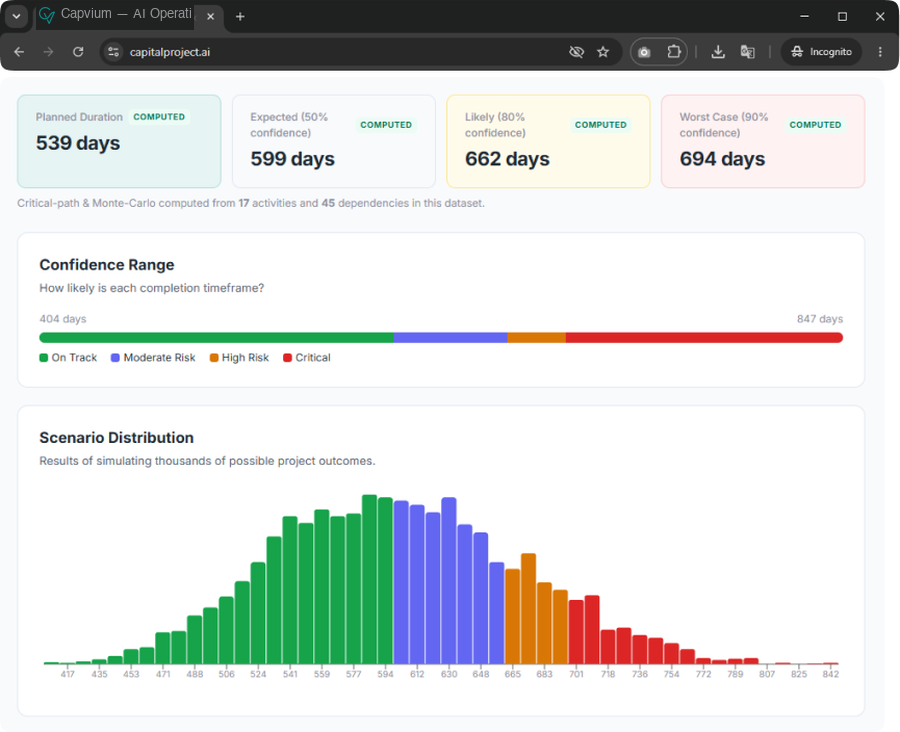
Probabilistic read in seconds. Simulated dates, cost ranges, critical paths.
The allocation engine. Sized commitments, downside numbers, stress tests.
Find bottlenecks before they find you.
Ask questions in plain English grounded in your actual portfolio data.
You don't have to take the recommendation on faith. Every number is explainable, comparable, and auditable.
Recommendations come back in dollars per option — including “zero” when an option shouldn't make the cut at any size.
Before showing you the upside, the engine reports the chance of severe loss and sizes commitments so one bad year can't sink the plan.
Options that share risks are modeled as sharing risks. Analyzed as a portfolio, not a stack of independent cases.
Every plan is run through base, stress, and upside scenarios. See which commitments hold across all three.
Shown side-by-side with ranked NPV, ranked IRR, and equal split so the committee sees exactly where we disagree.
Every run is logged. When someone asks “why did we fund this?” two years from now, the answer is one click away.


The fastest way to evaluate the engine is to point it at a decision you actually have to make this quarter. We'll run it with you.
Priced to the capital at stake, not the seat count.
See full pricing & features